10 Largest Growth Regions in the Next 30 Years
We recently published the above interactive map with 2050 projection data for all MSA’s in the US. First, let’s describe what a Metropolitan Statistical Area (MSA) is. Below is a snip from the definitions on Investopedia. It essentially groups the main city with its surrounding communities as a region for mainly demographic purposes.
Here we break down the data for the top ten in each category. It shows the average yearly percentage changes for population, employment, and personal income growth. Also showing where the figures are today and where they are projected to go in 2050 for more context.
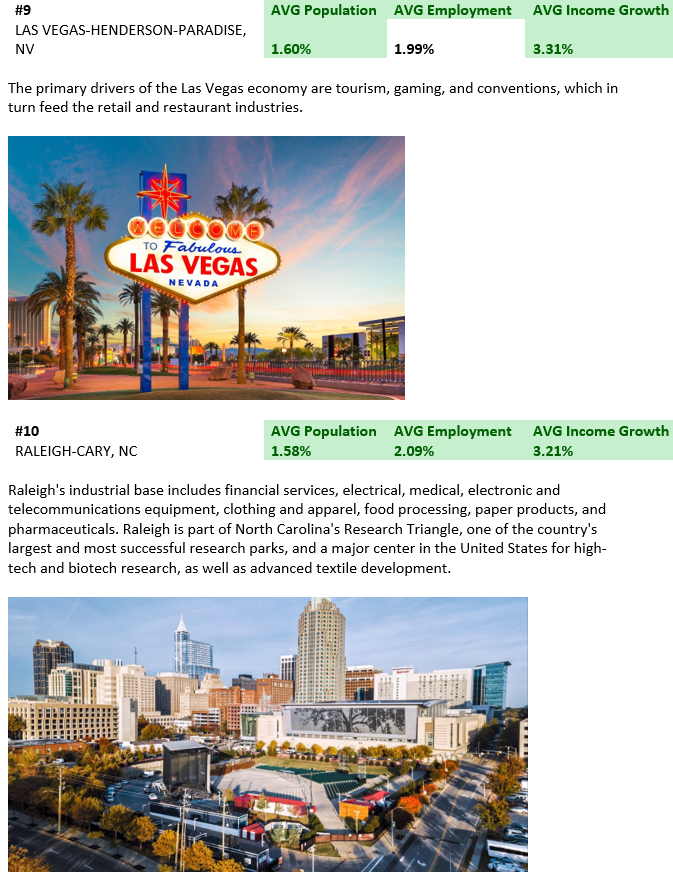
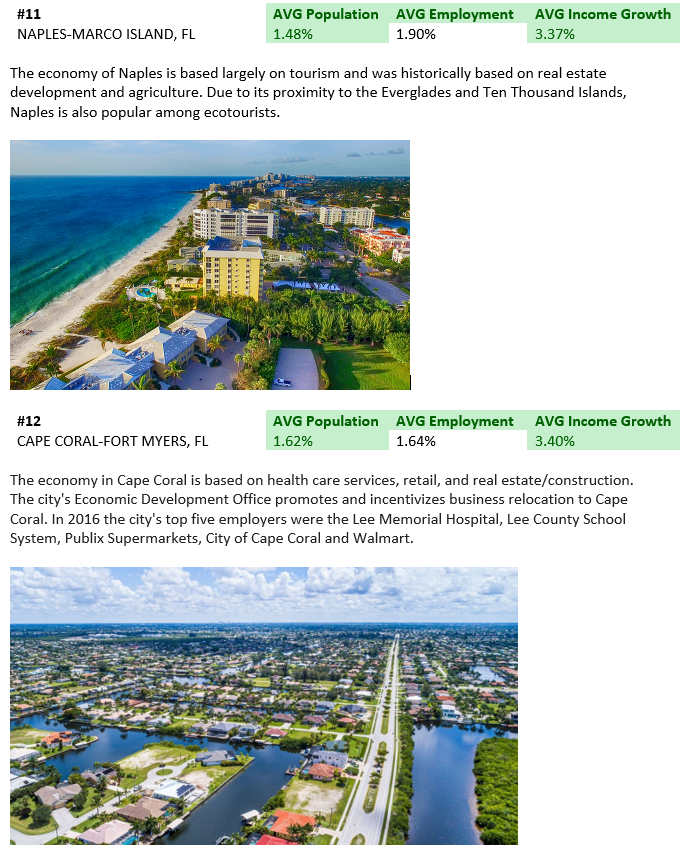
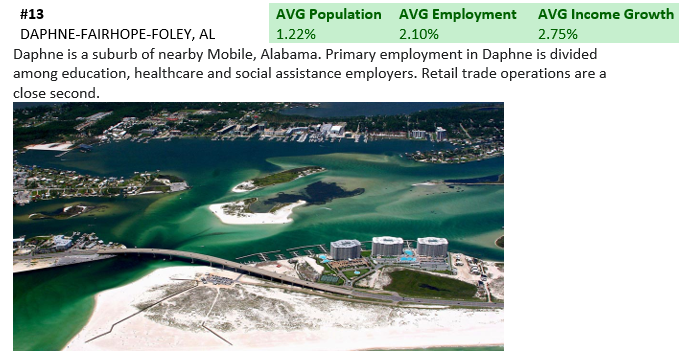
Below is a summary of the 13 MSA’s pointed out above. Just breaks down the same info of each place with a small description most of which coming from Wikipedia. All this information was extrapolated from raw data from Woods & Poole Economics.
Conclusion
In conclusion, there are many areas around the country that have great growth prospects. Some of them being places that we are targeting. At the end of the day, this information should be used for the high-level analysis of areas. To really get to know an area you need to be on the ground driving the neighborhoods and looking at property.
*The Data is not intended to constitute advice nor is it to be used as a substitute for specific advice from a professional. Users should not act (or refrain from acting) based upon information in the Data without independently verifying the information and obtaining any necessary professional advice.


